See It In Action
DataPlayground makes it easy to visualize your data with just a few clicks
Define Your Schema
Create fields for your data structure like Product, Category, and Sales.
Enter Your Data
Add rows of data based on your schema structure.
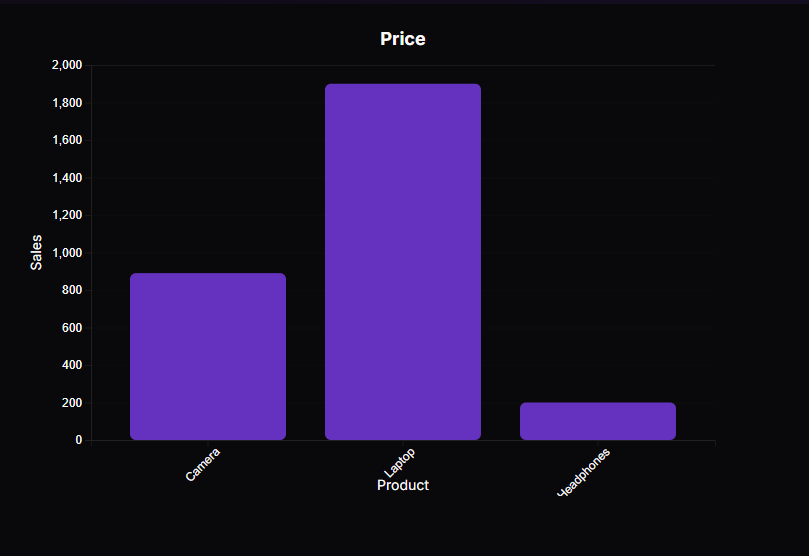
Visualize Results
Create interactive charts to visualize your data.
How It Works
A powerful yet simple workflow to visualize your data in minutes
Define Your Schema
Create custom fields with different data types to structure your data exactly how you need it.
Input Your Data
Add, edit, and delete rows of data with automatic validation based on your schema.
Visualize with D3.js
Create interactive charts and graphs that update in real-time as your data changes.
Export & Import
Save your work as JSON and reload it later, all within your browser.
Light & Dark Mode
Switch between light and dark themes based on your preference or system settings.
100% Client-Side
No backend. No tracking. No login. All data is session-based and lives in your browser.